Version 4.1 - Performance Monitoring Enhancements

Petro-SIM 4.1 refreshes many of the techniques you can use to build performance monitoring applications that let you analyze and track unit performance over time. The changes simplify how you build applications and improve how you view results, with user interface modes aimed just at engineers reviewing performance.
New functionality in Petro-SIM
- New KPI Utility to allow you to create key performance indicators. It supports built-in, customizable status indicators to track case completion as well as any user-defined indicator incorporating flowsheet parameters.
- Has built in modes to handle the Data Quality Parameters (DQP) and Model Performance Indicators (MPI) results used by Monitoring applications
- Supersedes the need to build spreadsheet operations, giving you more flexibility
- New utility makes it easier to read calculated KPI values from the database into third-party reporting applications
- Monitoring reports now support the Data Reconciliation utility as the preferred way of constructing and reconciling material balances, eliminating the need to set up separate spreadsheet and optimizer operations
- Updated Historian interface to make it easier to link to your process and lab data:
- Script tag type allows you to define calculated tags that can make of use other tag values. The calculation is defined as a script in a similar way to Script Properties on streams. Use it to validate variables, calculate missing variables such as exchanger bypasses and more.
- Added a formal mechanism for custom historian interfaces, allowing you to write your own extensions for talking to site historians or lab systems
New functionality in Excel Meter Report
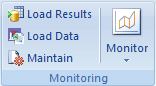
- Expanded the Monitoring group on the Petro-SIM Ribbon Bar for Microsoft Excel to add buttons for three commonly-used commands:
- New Load Results button lets you load available historical results to the History Report sheet, hiding unneeded functionality in the process
- Load Data button gives direct access to starting a new monitoring dataset
- Maintain button gives direct access to the view controlling your Monitoring preferences
- Added customizable reporting options for the History Report page, allowing you to add case results into the report without needing to define KPIs or to get calculated values added to meters
- Enhanced the charting options with new ad-hoc charts for trending results over time and for looking at values across an individual dataset
- Enhanced Bulk Run options to make it easier to set up timestamps for analysis. An alternative to automatic runs, the Bulk Run mechanism allows you to setup calculations for any set of dates you want. For example, you could use it once a month to run a set of analyses over the preceding month. The enhancements make it easier to build the set of dates for analysis, querying the database to start from your last stored set of results.