License Stats
KBC License Stats Tool
The KBC License Stats tool helps you understand license usage at your organization. It presents information graphically and in data table format, retrieving data from logs maintained by your license server. You query this data for information, and you can save charts between sessions. The tool also allows you to query the license server for real time usage.
Getting Started
Historical Analysis
- Select the log folder which contains your log files. See License Server Usage Logging for details of how to control logging.

- Right click on a feature under the Programs tree to add new chart. You can select License/Chips charts, User charts, and Failed Checkout charts.
Real-Time Analysis
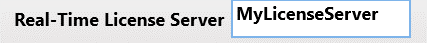
- Define the Real-Time Server name

- Once Real-Time License server has been defined, the Real-Time Usage button under Report will be enabled.

- Click on this button to see all the features that have been checked out and by whom and how many license are being used in real time.
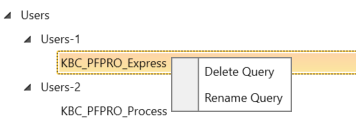
- You can also right click on a desired feature on the Program tree and select Real Time Usage.
Charts
License Charts – these charts display the maximum number of licenses checked out simultaneously over time for the selected feature.
Chips Charts – the Max Chip chart displays the maximum number of instances (ie. 3 copies of the FCC reactor) checked out simultaneously for the selected feature; the Total Chips chart displays the maximum number of chips checkout simultaneously for all the features combined. To see the Total Chips, select KBC_Bucket1 as your feature.
User Charts – these charts display the user’s usage duration for the selected feature. You can change the user in the dropdown menu on the ribbon bar.
Checkout Failures – these charts display the number of checkout failures for the selected feature. There are two options to create new charts:
- You can add new charts by right clicking on the Program tree under specific feature and select the chart type.

- You can also add a new chart by right clicking on the Chart type header and select Add Chart. This will provide a blank chart, so you will need to drag and drop a feature from the Programs tree onto your chart.

Once you have a chart created, you can add additional data series (ie. other features) by drag and dropping another feature from the Program tree on to the existing chart. To view individual data series, click on the data series on the Chart tree. To view a comparison of all the data series on one chart, click on the chart in the Chart tree.
Charts and data series can be renamed by selecting the chart or data series, right clicking and selecting rename.
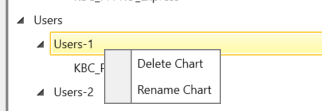
Charts and data series can also be deleted by selecting the chart or data series, right clicking and selecting delete. You can also use the Delete button at the bottom of the panel.
Setup
The Setup options give you the ability to display additional information on the charts and how to add the charts.
- Chart Values - display the values on the charts.
- Display License limits - display the total number of license available for the feature. This option is only available if the tool can access the License Server.
- Click to add to Chart - allow you to click on the feature tree to add to a chart, instead of dragging and dropping.
- Start Date and End Date – you can select the time range to view the log data.
Chart Type
Charts can either be a bar or graph type.

Report
Historical Usage - you can view the Historical Usage data in table format. You can export this information to Excel.
Real-Time Usage – you can view Real-Time Usage of the Real-Time License Server. You must provide a server name first. This can be different from your Log File License Server.
Sessions
Sessions can be created and recalled. Each session stores you log file path and chart information. When you exit the program, you will be prompted to save your current session.